SUI, a fast-rising cryptocurrency, has caught the eye of many investors and traders as the sui price gets closer to the important $2 mark. The big question now is whether it will break past $2 today. In this article, we’ll look at what’s affecting SUI price, the current market trends, and whether it has the strength to go beyond $2 soon.
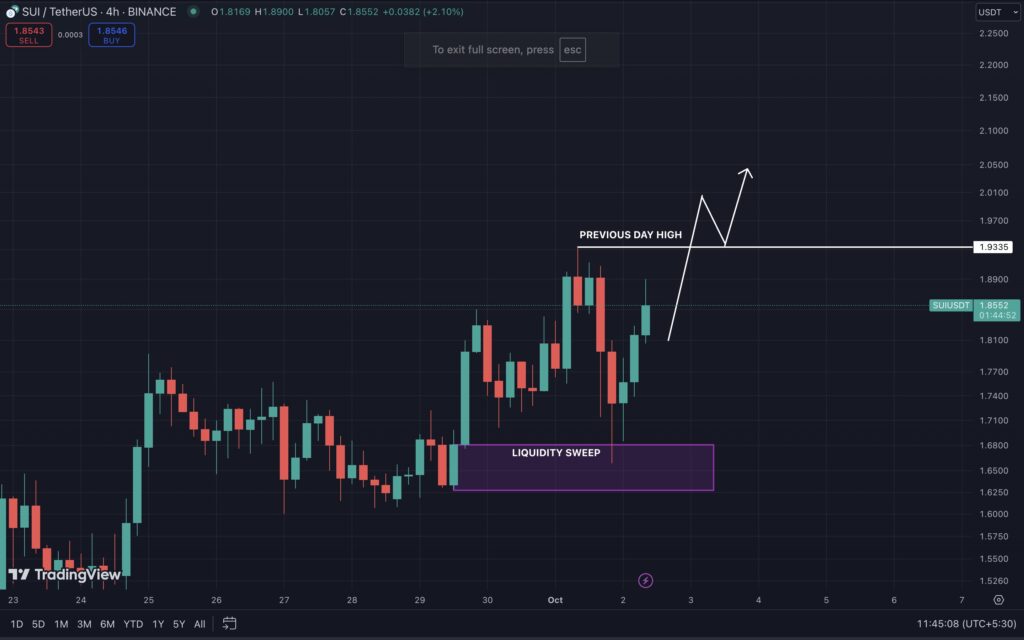
SUI – USDT Price Chart :

If you check the chart of SUI/USDT in the 4-hour timeframe:
Liquidity Sweep:
The chart shows a clear sweep of liquidity below the 1.70 level (highlighted in the purple box), which indicates that sell-side liquidity was grabbed. This is typically a strong signal that the price may reverse to the upside, especially after such a move.
Order Block:
The price bounced from a region near the liquidity sweep, which suggests that an order block or a demand zone around the 1.68 – 1.70 area was respected. After liquidity sweeps, price often reverses from order blocks to mitigate previous imbalances or inefficiencies.
Current Price Action:
The price is now trending towards the previous day’s high near 1.9335. This is a key resistance level to watch. If the price can convincingly break and hold above this level, further bullish momentum may push the price higher.
Lower Time Frame Confirmation:
Lower time frame candles are supporting the sui price momentum. If lower time frames show continuous bullish candles or sustained higher lows, this reinforces the likelihood of further upward momentum.
Conclusion:
While the chart looks favorable for a continued bullish move, whether SUI Price will reach 2$ today depends on whether it can break the 1.9335 resistance level with strength. If this level is broken with high volume and momentum, then 2$ is achievable, but if there’s rejection or consolidation near the previous day’s high, the upward move could slow down or reverse. Keep an eye on the volume and price action around the 1.9335 mark for further clues and stay updated by following Krypto Council


